


Understanding Linear Regression Cost Function: A Complete Guide for Machine Learning Beginners
ML(P5)

📚Chapter: 2 -Linear Regression with one Variable
If you want to read more articles about Machine Learning, don’t forget to stay tuned :) click here.
Table of Content
Overview of the Cost Function
Type of the Cost function
Understanding the Components of the Cost Function
1- Overview of the Cost Function
Def: In mathematical optimization and decision theory, a loss function or cost function (sometimes also called an error function) is a function that maps an event or values of one or more variables onto a real number intuitively representing some “cost” associated with the event.
Def: Also known as lost function or objective function, it measures the unhappiness with the job being done, that is, if the algorithm is very bad, its value will be high. Basically, it compares the correct category score with the other ones to say how satisfied it is. In machine learning, a cost function is a measure of how well a model performs. It is used to evaluate the model’s predictions and to guide the learning process. The goal of the learning process is to minimize the cost function, which means finding the set of parameters that produces the best predictions.The cost function is typically a mathematical function that takes the model’s predictions and the ground truth labels as input and outputs a single number. The lower the cost function value, the better the model’s predictions.
Def: In machine learning, a “cost function” quantifies the difference between predicted and actual values. It measures how well a model performs by assigning a penalty for prediction errors. The goal during training is to minimize this cost function, adjusting model parameters to achieve accurate predictions. Common cost functions include mean squared error for regression and cross-entropy for classification tasks. A well-designed cost function guides the learning process, steering the model towards optimal performance.
The cost function is an important part of machine learning. It is used to evaluate the model’s predictions and to guide the learning process. By choosing the right cost function, you can improve the performance of your machine learning models.
2- Type of the Cost function
There are many different types of cost functions, each of which is used for a different type of machine learning problemThe two most common loss functions are hinge loss and cross-entropy.

Mean squared error (MSE) cost function
mean squared error (MSE) cost function is often used for regression problems.This is a common cost function for regression problems. It is calculated as the average of the squared errors between the model’s predictions and the ground truth labels.
Cross-entropy cost function
cross-entropy cost function is often used for classification problems. This is a common cost function for classification problems. It is calculated as the sum of the probabilities of the incorrect labels, multiplied by the negative log of those probabilities.
Hinge loss
This is a cost function that is often used for support vector machines. It is calculated as the sum of the absolute values of the differences between the model’s predictions and the ground truth labels.
3- Understanding the Components of the Cost Function
This will let us figure out how to fit the best possible straight line to our data.
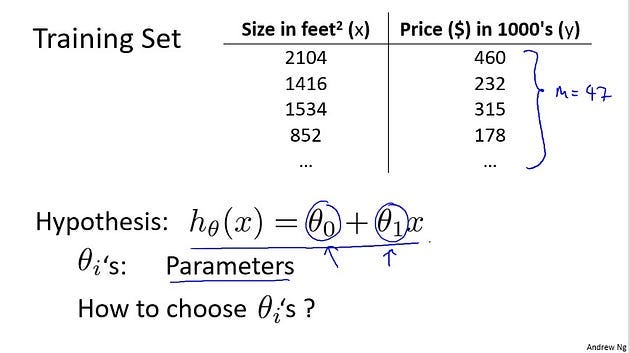
In linear regression, we have a training set like that shown here. Remember our notation M was the number of training examples. So maybe M=47. And the form of the hypothesis, which we use to make predictions, is this linear function. To introduce a little bit more terminology, these theta zero and theta one, right, these theta i’s are what I call the parameters of the model.

Choosing Parameter Values
how to go about choosing these two parameter values, theta zero and theta one. With different choices of parameters theta zero and theta one, we get different hypotheses and different hypothesis functions.
If theta zero is 1.5 and theta one is 0, then the hypothesis function will look like this. Right, because your hypothesis function will be h( x) equals 1.5 plus 0 times x which is this constant value function, this is flat at 1.5.
If theta zero equals 0 and theta one equals 0.5, then the hypothesis will look like this. And it should pass through this point (2, 1), says you now have h(x) or really some h<u>theta(x) but sometimes I’ll just omit theta for</u> brevity. So, h(x) will be equal to just 0.5 times x which looks like that.
And finally, if theta zero equals 1 and theta one equals 0.5 then we end up with a hypothesis that looks like this. Let’s see, it should pass through the (2, 2) point like so. And this is my new h(x) or my new h<u>theta(x).
All right? Well</u> you remember that this is h<u>theta(x) but as a shorthand</u> sometimes I just write this as h(x).
The objective function or Cost function for linear regression.
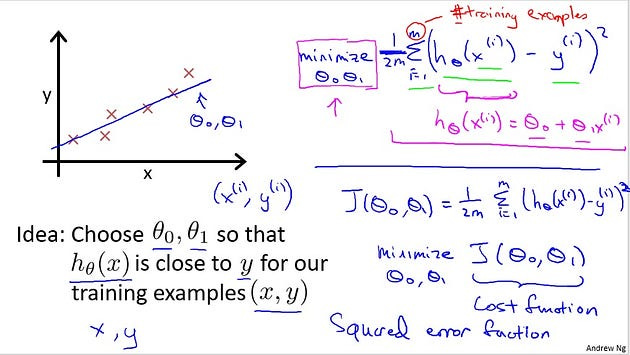
In linear regression, we have a training set, like maybe the one I’ve plotted here. What we want to do is come up with values for the parameters theta zero and theta one. So that the straight line we get out of this corresponds to a straight line that somehow fits the data well. Like maybe that line over there. So how do we come up with values theta zero, theta one that corresponds to a good fit to the data? The idea is we’re going to choose our parameters theta zero, and theta one so that h(x), meaning the value we predict on input x, that this is at least close to the values y for the examples in our training set, for our training examples.
So, in our training set we’re given a number of examples where we know x decides the house and we know the actual price of what it’s sold for. So let’s try to choose values for the parameters so that at least in the training set, given the x’s in the training set, we make reasonably accurate predictions for the yvalues.
Let’s formalize this. So linear regression, what we’re going to do is that I’m going to want to solve a minimization problem. So I’m going to write minimize over theta zero, theta one. And, I want this to be small, right, I want the difference between h(x) and y to be small. And one thing I’m gonna do is try to minimize the square \ difference between the output of the hypothesis and the actual price of the house.
Remember that I was using the notation (x(i), y(i)) to represent the ith training example. So what I want really is to sum over my training set. Sum from i equals 1 to M of the square difference between this is the prediction of my hypothesis when it is input the size of house number i, right, minus the actual price that house number i will sell for and I want to minimize the sum of my training set sum from i equals 1 through M of the difference of this squared error, the square difference between the predicted price of the house and the price that it will actually sell for. And just remind you of your notation M here was the, the size of my training set, right, so the M there is my number of training examples. Right? That hash sign is the abbreviation for the “number” of training examples.
Okay? And to make some of our, make the math a little bit easier, I’m going to actually look at, you know, 1 over M times that. So we’re going to try to minimize my average error, which we’re going to minimize one by 2M. Putting the 2, the constant one half, in front it just makes some of the math a little easier. So minimizing one half of something, right, should give you the same values of the parameters theta zero, theta one as minimizing that function. And just make sure this, this, this equation is clear, right?
This expression in here, h<u>theta(x), this is my, this is</u> our usual, right? That’s equal to this plus theta one x(i). And, this notation, minimize over theta zero and theta one, this means find me the values of theta zero and theta one that causes this expression to be minimized. And this expression depends on theta zero and theta one. Okay? So just to recap, we’re posing this problem as find me the values of theta zero and theta one so that the average already one over two M times the sum of square errors between my predictions on the training set minus the actual values of the houses on the training set is minimized.
So this is going to be my overall objective function for linear regression. And just to, you know rewrite this out a little bit more cleanly what I’m going to do by convention is we usually define a cost function. Which is going to be exactly this. That formula that I have up here. And what I want to do is minimize over theta zero and theta one my function J of theta zero comma theta one. Just write this out, this is my cost function.
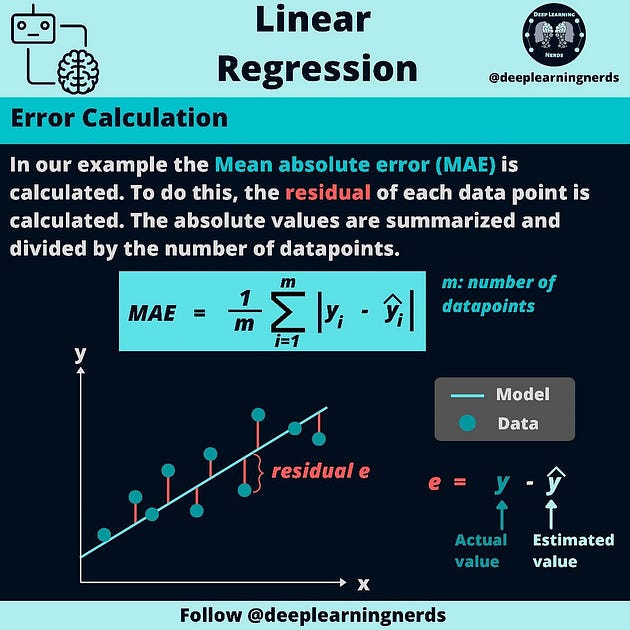
In task with the continuous target cost function is the loss error function (usually called Mean Squared Error), while in a task with the categorical target the loss function is cross-entropy. We will focus here on the first one. With the model m, we get some prediction value y’ for each row (data point). For each of our data points, we can see how this prediction differs for each data point from the true value (y).
J = (∑(y’-y)²)/n
So, this cost function is also called the squared error function or sometimes called the square error cost function and it turns out that Why, why do we, you know, take the squares of the errors? It turns out that the squared error cost function is a reasonable choice and will work well for most problems, for most regression problems. There are other cost functions that will work pretty well, but the squared error cost function is probably the most commonly used one for regression problems. Later in this class, we’ll also talk about alternative cost functions as well, but, this choice that we just had, should be a pret-, pretty reasonable thing to try for most linear regression problems.
4- Conclusion
Okay. So that’s the cost function. So far we’ve just seen a mathematical definition of you know this cost function and in case this function J of theta zero theta one in case this function seems a little bit abstract and you still don’t have a good sense of what its doing in the next video, in the next couple videos we’re actually going to go a little bit deeper into what the cost function J is doing and try to give you better intuition about what its computing and why we want to use it.
Please Subscribe courses teach to see latest updates on this story
If you want to learn more about these topics: Python, Machine Learning Data Science, Statistic For Machine learning, Linear Algebra for Machine learning Computer Vision and Research
Then Login and Enroll in Coursesteach to get fantastic content in the data field.
Stay tuned for our upcoming articles where we will explore specific topics related to Machine Learning in more detail!
Remember, learning is a continuous process. So keep learning and keep creating and Sharing with others!💻✌️
Note:if you are a Machine Learning export and have some good suggestions to improve this blog to share, you write comments and contribute.
if you need more update about Machine Learning and want to contribute then following and enroll in following
👉Course: Machine Learning (ML)
References
1- Machine Learning (Andrew)
2- Google Bar