


Logistic Regression Testing Explained: Compute Accuracy and Evaluate Model Performance in Sentiment Analysis
Natural Language Processing (Part 11)

📚Chapter 2: Sentiment Analysis (logistic Regression)
If you want to read more articles about NLP, don’t forget to stay tuned :) click here.
Logistic Regression: Testing
Now that you have your Theta, you will use this theta to predict our new data points. For example, given a new tweet, you will use this theta to say whether this tweet is positive or negative. In doing so, you want to analyze whether your model generalizes well or not. In this tutorial, we will show you whether your model generalizes well or not, and specifically, we’ll show you how to compute the accuracy of your model.
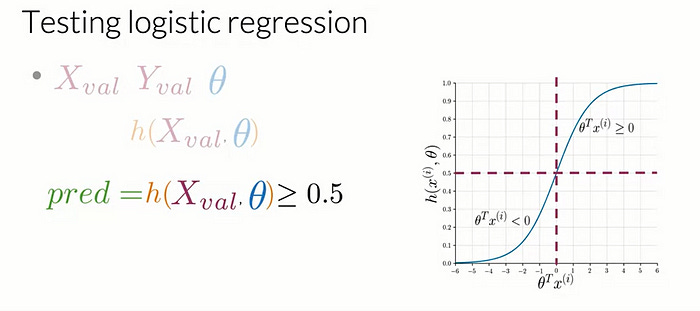
Let’s take a look at how you can do this. For this, you will need X_val and Y_val. Theta that was set aside during training, also known as the validation sets and Theta, the sets of optimum parameters that you got from training on your data. First, you will compute the sigmoid function for X_val with parameters Theta, then you will evaluate if each value of h of Theta is greater than or equal to a threshold value, often set to 0.5.
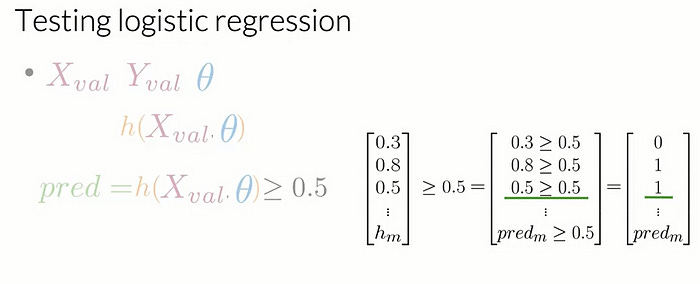
For example, if your h X Theta is equal to the following vector, 0.3, 0.8, 0.5, etc., up to the number of examples from your validation set, you’re going to assert if each of its components is greater than or equal to 0.5. So is 0.3 greater than or equal to 0.5? No. So our first prediction is equal to 0. Is 0.8 greater than or equal to 0.5? Yes. So our prediction for the second example is 1. Is 0.5 greater than or equal to 0.5? Yes. So our third prediction is equal to 1, and so on. At the end, you will have a vector populated with zeros and ones indicating predicted negative and positive examples, respectively.
After building the predictions vector, you can compute the accuracy of your model over the validation sets
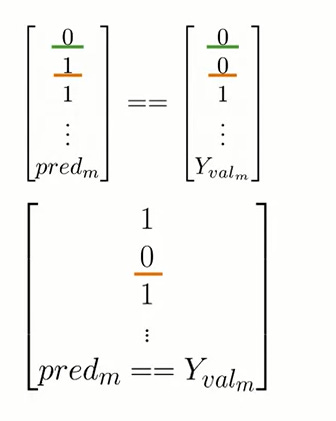
To do so, you will compare the predictions you have made with the true value for each observation from your validation data. If the values are equal and your prediction is correct, you’ll get a value of 1 and 0 otherwise. For instance, if your prediction was correct, like in this case where your prediction and your label are both equal to 0, your vector will have a value equal to 1 in the first position. Conversely, if your second prediction wasn’t correct because your prediction and label disagree, your vector will have a value of 0 in the second position and so on and so forth. After you have compared the values of every prediction with the true labels of your validation set, you can get the total times that your predictions were correct by summing up the vector of the comparisons. Finally, you’ll divide that number over the total number m of observations from your validation sets. This metric gives an estimate of the times that your logistic regression will correctly work on unseen data. So if your accuracy is equal to 0.5, it means that 50 percent of the time, your model is expected to work well.
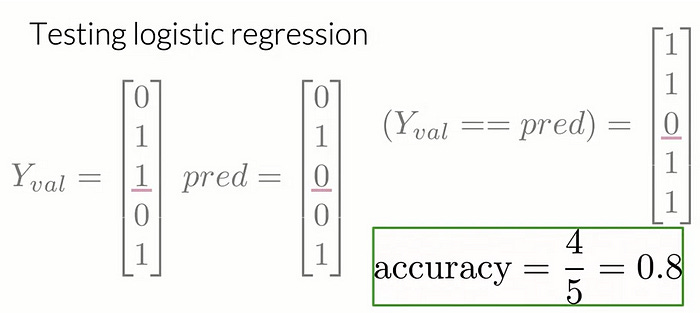
For instance, if your Y_val and prediction vectors for five observations look like this, you’ll compare each of their values and determine whether they match or not. After that, you’ll have the following vector with a single 0 in the third position where the prediction and the label disagree. Next, you have to sum the number of times that your predictions were right and divide that number by the total number of observations in your validation sets. For example, you get an accuracy equal to 80 percent.
You learned many concepts this week. The first thing you learned is you learned how to preprocess a text. You learned how to extract features from that text. You learned how to use those extracted features and train a model using those. Then you learned how to test your model.
Let’s connect: If you found this helpful, share your thoughts or questions in the comments! 😊
Please Follow and 👏 Subscribe for the story courses teach to see latest updates on this story
🚀 Elevate Your Data Skills with Coursesteach! 🚀
Ready to dive into Python, Machine Learning, Data Science, Statistics, Linear Algebra, Computer Vision, and Research? Coursesteach has you covered!
🔍 Python, 🤖 ML, 📊 Stats, ➕ Linear Algebra, 👁️🗨️ Computer Vision, 🔬 Research — all in one place!
Don’t Miss Out on This Exclusive Opportunity to Enhance Your Skill Set! Enroll Today 🌟 at
Natural Language Processing with Probabilistic models Resources Course
Natural Language Processing Resources course
🔍 Explore cutting-edge tools and Python libraries, access insightful slides and source code, and tap into a wealth of free online courses from top universities and organizations. Connect with like-minded individuals on Reddit, Facebook, and beyond, and stay updated with our YouTube channel and GitHub repository. Don’t wait — enroll now and unleash your NLP potential!”
Stay tuned for our upcoming articles where we will explore specific topics related to NLP in more detail!
Remember, learning is a continuous process. So keep learning and keep creating and sharing with others!💻✌️
We offer following serveries:
We offer the following options:
Enroll in my Computer Vision course: You can sign up for the course at this link. The course is designed in a blog-style format and progresses from basic to advanced levels.
Access free resources: I will provide you with learning materials, and you can begin studying independently. You are also welcome to contribute to our community — this option is completely free.
Online tutoring: If you’d prefer personalized guidance, I offer online tutoring sessions, covering everything from basic to advanced topics.
Contribution: We would love your help in making coursesteach community even better! If you want to contribute in some courses , or if you have any suggestions for improvement in any coursesteach content, feel free to contact and follow.
Together, let’s make this the best AI learning Community! 🚀
Source
1- Natural Language Processing with Classification and Vector Spaces