


How to Handle Missing Data in Machine Learning Using Scikit-learn-Supervised learning with scikit-learn
Supervised learning with scikit-learn (Part 7)

📚Chapter:3-Data Preprocessing and Pipelines
If you want to read more articles about Supervise Learning with Sklearn, don’t forget to stay tuned :) click here.
Introduction
In the vast landscape of data science, one inevitable challenge is dealing with missing data. Missing values can arise from a variety of reasons, ranging from human error during data collection to technical issues in data storage. In this blog post, we’ll explore how scikit-learn, a powerful machine learning library in Python, provides effective tools for handling missing data. Understanding these techniques is essential for ensuring the robustness and reliability of your machine-learning models.
Sections
What is Data Cleaning?
Why Data cleaning is important?
How to clean data
Missing Data
Why do We Need to Fill Missing Values in a dataset ?
How to Check Missing Values
Visualization of Missing Values
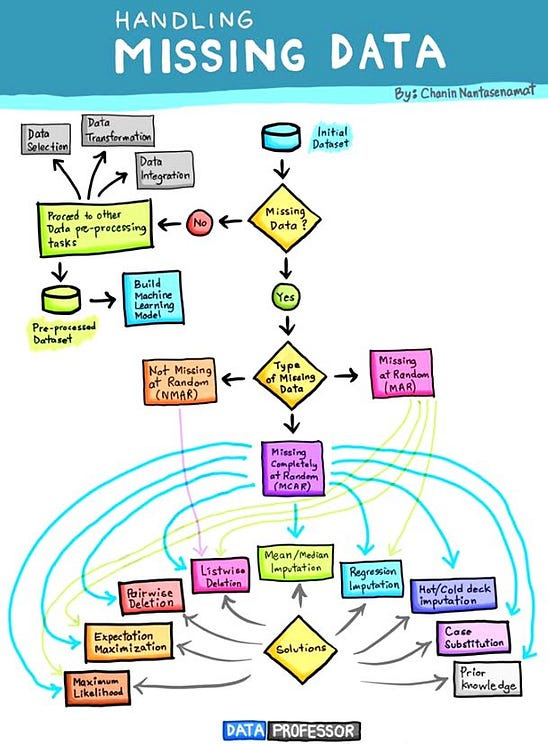
Handling missing data
Best Practices for Handling Missing Data
Conclusion:
Section 1- What is Data Cleaning?
The process of detecting and correcting (or removing) corrupt or inaccurate records from a record set, table, or database and refers to identifying incomplete, incorrect, inaccurate or irrelevant parts of the data and then replacing, modifying, or deleting the dirty or coarse data [1]. Data cleaning is the technique of eliminating garbage, incorrect, duplicate, corrupted, or incomplete data in a dataset as part of the data preparation process with a motive to build reliable, uniform, and standardized data sets. Python pandas is an excellent library for manipulating data and analyzing it. From this definition, we can say that the aspects of clean data are:
Complete
Correct
Accurate
Relevant
Section 2- Why Data cleaning is important?
Data cleaning is a crucial step in the data science pipeline as the insights and results you produce is only as good as the data you have. As the old adage goes — garbage in, garbage out [1]. Using dirty data to produce analysis will result in erroneous predictions that engender bad decisions and dangerous outcomes. Not only that, most machine learning algorithms only work when your data is properly cleaned and fit for modeling [1].
Section 3- How to clean data
Missing data
Inconsistent data/Irrelevant features
Outliers
Section 4- Missing Data
Data can have missing values for a number of reasons, such as observations that were not recorded and data corruption. Handling missing data is important as many machine learning algorithms do not support data with missing values. Missing values is one of the most common problems you saw when you are doing feature engineering/data preparation. The main reasons for the missing values because of human errors and data privacy and so on. There are four ways you can perform data cleaning.
Section 5: Why do We Need to Fill Missing Values in a dataset ?
Before delving into the solutions, it’s crucial to understand the impact of missing data on your analyses. Missing values can distort statistical measures, introduce bias, and hinder the performance of machine learning models. Therefore, addressing missing data is a critical step in the data preprocessing pipeline.
Sometimes the dataset we use to solve a problem contains a lot of missing values that can adversely affect the performance of a machine learning model. A dataset with a lot of missing values can give us wrong information. So if we have missing values in a dataset, here are some strategies we can choose to deal with them:
Removing the whole row that contains missing values
Filling the missing values according to the other known values
The first strategy is to remove the entire row containing a missing value. This is not a bad idea, but it can only be considered when the data is very large. If removing missing values results in a data shortage, then this will not be an ideal dataset for any data science task. This is where the second strategy comes in, which is to fill in the missing values according to the other known values. This strategy can be considered in any type of dataset.
So this is why we need to fill the missing values in a dataset. In the section below, I will take you through a tutorial on how to fill in missing values in a dataset using Python.
Section 6- — How to Check Missing Values
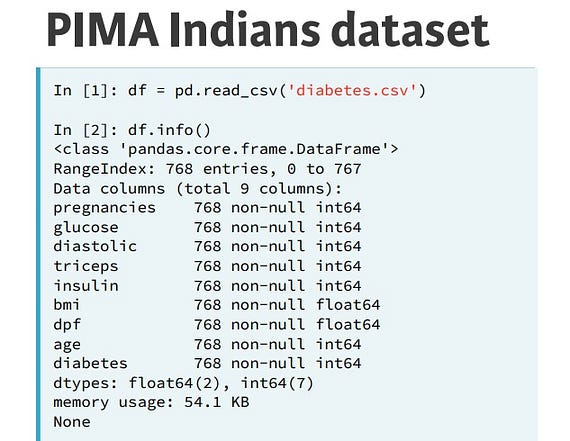
Let’s now load the PIMA Indians dataset. It doesn’t look like it has any missing values as, according to df dot info, all features have 768 non-null entries. However, missing values can be encoded in a number of different ways, such as by zeroes, or question marks, or negative ones.
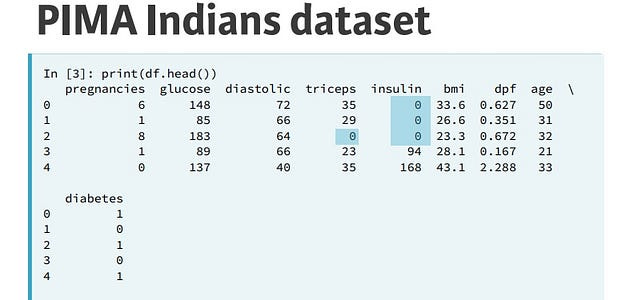
Checking out df dot head, it looks as though there are observations where insulin is zero. And triceps, which is the thickness of the skin, is zero. These are not possible and, as we have no indication of the real values, the data is, for all intents and purposes, missing.
How to find the exact location of null values in a pandas data frame and see the whole row?[4]
# Syntaxdf[df.isna().any(axis=1)]# Exampleimport pandas as pd
titanic = pd.read_csv(“train.csv”)
titanic[titanic.isna().any(axis=1)]
How to check for percentages of null values in each column?[4]
This is a pretty fast way to see how bad the damage is in each column of your whole data frame.
titanic.notnull().mean()total = oversampled.isnull().sum().sort_values(ascending=False)
percent = (oversampled.isnull().sum()/oversampled.isnull().count()).sort_values(ascending=False)
missing = pd.concat([total, percent], axis=1, keys=['Total', 'Percent'])
missing.head(4)If you want to see missing values for all columns, use this command:
oversampled.isnull().sum()This gives you the percentage of missing values in each of the columns. Knowing the percentage can be useful in determining whether you should drop the column.
def perc_missing(df):
    '''prints out columns with missing values with its %'''
    for col in df.columns:
        pct = df[col].isna().mean() * 100
        if (pct != 0):
            p
Section 7- Visualization of Missing Values
Missing
It is common to find missing values in a real-world dataset. We need to understand the missing values before imputing. Missingo offers a quick and helpful way to visualize the missing values.
!pip install missingno# importing necessary libraries
import pandas as pd
import missingno as mi
# reading the dummy dataset
#data = pd.read_excel(“dummy.xlsx”)
# checking missing values
oversampled.isnull().sum()The Dummy dataset has 11 rows and four columns. Missing values are presented in Min, Temp, and city variables. We can visualize using a bar graph and matrix. It also supports heatmap, dendrogram
#Visualizing using missingo
print('Visualizing missing value using bar graph')
mi.bar(oversampled, figsize = (10,5))
print('Visualizing missing value using matrix')
mi.matrix(oversampled, figsize = (10,5) )
Heatmap
Heatmaps are also useful to visualize your missing values, in particular at which point of the data do missing values exists.
import pandas as pd
import seaborn as sns
import numpy as np
import matplotlib.pyplot as plt
plt.style.use('fivethirtyeight')%matplotlib inlineplt.figure(figsize=(10, 6))
sns.heatmap(oversampled.isnull(), yticklabels=False, cmap='viridis', cbar=False)Section 7. Handling missing data
We say that data is missing when there is no value for a given feature in a particular row. This can occur in the real world for many reasons: there may have been no observation, there may have been a transcription error, or the data may have been corrupted. Whatever the case, we, as data scientists, need to deal with it.
Imputation
Drop the missing values
Replace the missing values
Replace each NaN with a scalar value,
Fill the missing values forward or backward
Chained equations (MICE)
Scikit-learn is a versatile and widely used machine-learning library in Python. While it is primarily known for its machine learning algorithms, it also provides powerful tools for data preprocessing, including data cleaning. Some key modules and functions within scikit-learn for data cleaning include
1- Data imputation
Def: Filling missing values with data is called data imputation
Def: It is a process to assign or substitute the missing row/column value with the desired/calculated value [9].
Imputation Techniques
Statistic: and a popular approach for data imputation is to calculate a statistical value for each column (such as a mean) and replace all missing values for that column with the statistic.
Mean :Another option is to impute missing data. All imputing means is to make an educated guess as to what the missing values could be. A common strategy is, in any given column with missing values, to compute the mean of all the non-missing entries and to replace all missing values with the mean. Let’s try this now on our dataset. After transforming the data, we could then fit our supervised learning model to it, but is there a way to do both at once? [5].
Mode : One of the most common interpolation techniques is mean imputation where we simply replace the missing value with mean value of the entire feature column, other options for imputing missing value are median or most frequent (mode).
Uni-variate: In the case of numerical feature, the missing data can be replaced by mean/median/random value. In the case of the category
feature, the missing value can b [9]
Imputation with SimpleImputer:
One of the primary tools scikit-learn offers for handling missing data is the SimpleImputer class. This class provides a straightforward mechanism for imputing missing values with various strategies such as mean, median, most frequent, or a constant value.
from sklearn.impute import SimpleImputer
# Create an imputer object with the chosen strategy
imputer = SimpleImputer(strategy='mean')
# Fit and transform the data
X_imputed = imputer.fit_transform(X)
from sklearn.preprocessing import Imputer
imp = Imputer(missing_values='NaN', strategy='mean', axis=0)
imp.fit(X)
X = imp.transform(X)2- Imputing within a pipeline
There sure is! We can use the scikit-learn pipeline object. We import Pipeline from sklearn dot pipeline and Imputer from sklearn dot preprocessing. We also instantiate a log reg model. We then build the Pipeline object! We construct a list of steps in the pipeline, where each step is a 2-tuple containing the name you wish to give the relevant step and the estimator. We then pass this list to the Pipeline constructor. We can split our data into training and test sets and
from sklearn.pipeline import Pipeline
from sklearn.preprocessing import Imputer
imp = Imputer(missing_values='NaN', strategy='mean', axis=0)
logreg = LogisticRegression()
steps = [('imputation', imp), ...: ('logistic_regression', logreg)]
pipeline = Pipeline(steps)
X_train, X_test, y_train, y_test = train_test_split(X, y, ...: test_size=0.3, random_state=42)
fit the pipeline to the training set and then predict on the test set, as with any other model. For good measure here, we compute accuracy. Note that, in a pipeline, each step but the last must be a transformer and the last must be an estimator, such as, a classifier or a regressor.
In [8]: pipeline.fit(X_train, y_train)
In [9]: y_pred = pipeline.predict(X_test)
In [10]: pipeline.score(X_test, y_test)
Out[10]: 0.75324675324675328
3. Dropping missing data
Before we go any further, let’s make all these entries ‘NaN’ using the replace method on the relevant columns. So, how do we deal with missing data? One way is to drop all rows containing missing data.
We can do so using the pandas DataFrame method dropna. Checking out the shape of the resulting data frame, though, we see that we now have only approximately half the rows left! We’ve lost half of our data and this is unacceptable. If only a few rows contain missing values, then it’s not so bad, but generally we need a more robust method. It is generally an equally bad idea to remove columns that contain NaNs.
df = df.dropna()
df.shape
(393, 9)
The easiest way to deal with missing data is simply to throw the data point However, the removal of samples or dropping of entire feature columns is simply not feasible because we might lose too much valuable data. Drop the missing value Colum. Default axis=0 will excludes an entire row for an NaN value.
4-Replace each NaN with scalar value
To replace values, the fillna function is also used. Replace each NaN we have in the dataset, we can use the replace() method [24], You define the value you want to replace in the key, and the substitute in the value — {column_name: replacement_for_NA}. Here are examples for replacing values in the columns reviews_per_month and name
# replace null values in reviews_per_month with 0
Train_data.fillna({'RESULT_TEXT':0}, inplace=True)
missing_cols(Train_data)
from numpy import NaN
Train_data.replace({NaN:1.00})In order to replace with a Scalar Value, use fillna() method
Train_data.fillna(12)5-Fill missing value forward or Backward
Fill the missing values forward or backward. To fill forward or backward, use the methods pad or fill, and to fill backward, use bfill and backfill [24]
Train_data.fillna(method='backfill')6-Filling missing value with KNNImputer[8]
Scikit-learn offers multiple ways to impute missing values. Here, we consider two approaches. The SimpleImputer class provides basic strategies for imputing missing values (through the mean or median for example). A more sophisticated approach the KNNImputer class, which provides imputation for filling in missing values using the K-Nearest Neighbors approach. Each missing value is imputed using values from the n_neighbors nearest neighbors that have a value for the particular feature. The values of the neighbors are averaged uniformly or weighted by distance to each neighbor.
Multi-variate: In this method, we will fill the missing value with the KNN imputer (Hot-Deck imputation) algorithm and iterative method, i.e., MICE [9].
Below, we show an example application using both imputation methods:
from sklearn.experimental import enable_iterative_imputer
from sklearn.impute import SimpleImputer, KNNImputer
from sklearn.datasets import make_classification
import pandas as pd
X, y = make_classification(n_samples=5, n_features=4, n_classes=2, random_state=123)
X = pd.DataFrame(X, columns=['Feature_1', 'Feature_2', 'Feature_3', 'Feature_4'])
print(X.iloc[1,2])
X.iloc[1, 2] = float('NaN')
imputer_simple = SimpleImputer()
pd.DataFrame(imputer_simple.fit_transform(X))
Resulting in a value of -0.143476.Next, we try the KNN imputer, where the 2 nearest neighbors are considered and the neighbors are weighted uniformly:
imputer_KNN = KNNImputer(n_neighbors=2, weights="uniform")
pd.DataFrame(imputer_KNN.fit_transform(X))
7-Importing missing value with pipeline
from sklearn.pipeline import Pipeline
#from sklearn.preprocessing import Imputer
from sklearn.impute import SimpleImputer
mp = SimpleImputer(missing_values='NaN', strategy='mean')
logreg = LogisticRegression()
steps = [('imputation', mp),('logistic_regression', logreg)]
pipeline = Pipeline(steps)
X_train, X_test, y_train, y_test = train_test_split(X, y, test_size=0.3, random_state=42)
pipeline.fit(X_train, y_train)
y_pred = pipeline.predict(X_test)
pipeline.score(X_test, y_test)8- Chained equations (MICE)
This code performs multiple imputation by chained equations (MICE) to handle missing values in a dataset.
import warnings# This imports the Python module for handling warnings.
warnings.filterwarnings("ignore")# This line ignores any warnings that might be raised during the execution of the code.
# Multiple Imputation by Chained Equations
# This line enables the experimental version of the iterative imputer in the scikit-learn library.
# Iterative imputation is a technique for imputing missing values by modeling each feature with missing values as a function of other features.
from sklearn.experimental import enable_iterative_imputer
from sklearn.impute import IterativeImputer
MiceImputed = X.copy(deep=True)
mice_imputer = IterativeImputer()
MiceImputed.iloc[:, :] = mice_imputer.fit_transform(X)
Section 8 — Best Practices for Handling Missing Data
Understand the Nature of Missing Data: Investigate why data is missing. Is it missing completely at random, or is there a pattern? Understanding this can guide the choice of imputation strategy.
Evaluate the Impact of Imputation: Assess how different imputation strategies affect your model’s performance. Cross-validation can be a useful tool for this evaluation.
Consider Multiple Imputation: If uncertainty is a concern, consider using techniques like Multiple Imputation to account for the variability introduced by imputing missing values.
Document Your Approach: Clearly document the decisions and methods used for handling missing data. This ensures transparency in your data preprocessing pipeline.
Conclusion:
Handling missing data is an integral part of the data preprocessing journey, and scikit-learn provides a comprehensive set of tools to address this challenge. From simple imputation strategies to advanced techniques for more complex scenarios, scikit-learn empowers data scientists to make informed decisions when faced with missing values. By mastering these tools, you can enhance the quality and reliability of your machine learning models, ensuring they are built on a solid foundation of complete and accurate data.
Please Follow and 👏 Subscribe for the story courses teach to see latest updates on this story
🚀 Elevate Your Data Skills with Coursesteach! 🚀
Ready to dive into Python, Machine Learning, Data Science, Statistics, Linear Algebra, Computer Vision, and Research? Coursesteach has you covered!
🔍 Python, 🤖 ML, 📊 Stats, ➕ Linear Algebra, 👁️🗨️ Computer Vision, 🔬 Research — all in one place!
Enroll now for top-tier content and kickstart your data journey!
Supervised learning with scikit-learn
Stay tuned for our upcoming articles where we will explore specific topics related to Supervise Learning with sklearn in more detail!
Remember, learning is a continuous process. So keep learning and keep creating and sharing with others!💻✌️
Note:if you are a Machine learning export and have some good suggestions to improve this blog to share, you write comments and contribute.
Ready to dive into data science and AI but unsure how to start? I’m here to help! Offering personalized research supervision and long-term mentoring. Let’s chat on Skype: themushtaq48 or email me at mushtaqmsit@gmail.com. Let’s kickstart your journey together!
Contribution: We would love your help in making coursesteach community even better! If you want to contribute in some courses , or if you have any suggestions for improvement in any coursesteach content, feel free to contact and follow.
Together, let’s make this the best AI learning Community! 🚀
To Do List
1- Collects Keys points from the blogs
References
2–1_28_2020_Supervised_learning_with_Sklearn.ipynb
3-Data_Processing_in_Python_.ipynb
4- Python Tricks for Data Science
6- Approaches to Data Imputation(Unread)
8-Scikit-Learn (Python): 6 Useful Tricks for Data Scientists
9- In-depth Handling/Imputation Techniques of Missing Values in Feature Transformation